Greenwicher's WikiFRM - Fountations of Risk Management 2017-07-07
[Last Update: Aug 29, 2017]
Risk Management: A Helicopter View
The Concept of Risk
LO 1.1: Explain the concept of risk and compare risk management with risk taking.
risk: arises from the uncertainty regarding future losses and gains, and the most important concern is the variabilit of the loss, especially a loss that could rise to unexpectedly high levels or a loss that suddenly occurs that was not anticipated.risk management: includes the sequence of activites aimed to reduce or eliminate an entity’s poential to incur expected and unexpected losses, and further considers how an entity can consciously determine how much risk it is willing to take to earn future uncertain returnsrisk taking: refers specifically to the active assumption of incremental risk in order to generate incremental gains
The Risk Management Process
LO 1.2: Describe the risk management process and identify problems and challenges that can arise in the risk management process.
risk management process- Identify the risks.
- Quantify and estimate the risk expousures or determine appropriate methods to transfer the risks
- Determine the collective effects of the risk exposures or perform a cost-benefit analysis on risk transfer methods
- Develop a risk mitigation strategy (i.e., avoid, transfer, mitigate, or assume risk)
- Assess performance and amend risk mitigation strategy as needed
- problems
- identify the corrrect risk(s)
- find an efficient method of transferring the risk
- challenges
- risk must be sufficiently dispersed among willing and able participants in the economy
- prevent market disruptions or prevent financial accounting fraud
- the use of derivatives as complex trading strategies assised in overstating the financial position
- may not be effective on an overall economic basis because it only involves risk transferring by one party and risk assumption by another party
Measuring and Managing Risk
LO 1.3: Evaluate and apply tools and procedures used to measure and manage risk, including quantitative measures, qualitative assessment, and enterprise risk management.
- Quantitative Measures
value at risk: a certain loss amount given its probability of occurring- useful for liquid positions operating under normal market circumstances over a short period of time
- less useful and potentially dangerous when attempting to measure risk in non-normal circumstances, in illiquid positions, and over a long period of time
economic capital: refers to holding sufficient liquid reserves to cover a poential loss
- Qualitative Assessment
scenario analysis: take into account poential risk factors with uncertainties that are often non-quantifiable by considering an adverse scenario or worst-case scenariostress testing: a form of scenario analysis that examines a financial outcome based on a given “stress” on the entity
Enterprise Risk Management(ERM): considers entity-wide risks and tries to integrate risk considerations into key business decisions
Expected and Unexpected Loss
LO 1.4: Distinguish between expected loss and unexpected loss, and provide examples of each.
expected loss: considers how much an entity expects to lose in the normal course of business and can often be computed in advance (and provided for) with relative ease because of the certainty involvedpercentage of annual credit sales that will never be collected, bad debt expense on the income statement
recovered by charing commissions and increase prices
unexpected loss: considers how much an entity could lose outside of the normal course of business, and is generally more difficult to predict, compute and provide for in advance because of the uncertainty involvedcorrelation risk (economic recession: less disposable income to spend and many more loan defaults are likely to occur)
Risk and Reward
LO 1.5: Interpret the relationship between risk and reward and explain how conflicts of interest can impact risk management.
- trade-off: the greater the risk taken, the greater the poential reward (the variability of the poential reward should be considered, risk and uncertainty)
- easier to examin with publicly traded securities, more challenging when dealing with non-publicly traded securites
- adjusted returns for risk
Risk Classes
LO 1.6: Describe and differentiate between the key classes of risks, explain how each type of risk can arise, and assess the poential impact of each type of risk on an organization.
market risk: considers how changes in market prices and rates will result in investment losses- interest rate risk
- equity price risk
- general market risk
- specific risk
- foreign exchange risk
- commodity price risk
credit risk: refers to a loss suffered by a party whereby the counterparty fails to meet its financial obligations to the party under the contract (recovery value, loss given default)- default risk
- bankruptcy risk
- downgrade risk
- settlement risk
liquidity risk- funding liquidity risk
- trading liquidity risk
operational risk: considers a wide range of “non-financial” problemslegal and regulatory riskbusiness riskstrategic riskreputation risk
Corporate Risk Management: A Primer
Hedging Risk Exposures
LO 2.1 Evaluate some advantages and disadvantages of hedging risk exposures
- Disadvantages
- In Theory
- M&M Theory: no need to hedge in perfectly competitive capital markets with no transaction costs or taxes
- CAPM: firms should only be concerned with systematic risk (beta risk) instead of unsystematic risk (idiosyncratic risk) under perfect capital markets
- Zero-sum game: derivatives pricing fully reflects all of its risk factors in perfect capital markets
- In practice
- cause management to lose focus on the core business
- use a flawed hedging strategy
- incur compliance costs
- reveal operational information that a firm may otherwise prefer to keep private
- may end up increasing the variability of the firm’s earnings due to the difference between accounting earnings and cash flows
- In Theory
- Advantages
- In practice
- the possibility of lowering its cost of capital
- reduce the volatility and greater stability of earnings/cash flows
- allow managment to control its financial performance to meet the requirements of the board of directors
- operational improvements within a firm
- derivatives may be cheaper than insurance
- tax ductions
- In practice
Hedging Decisions
LO 2.2 Explain considerations and procedures in determining a firm’s risk appetite and its business objectives
- set the firm’s risk appetite using qualitative statements of risk tolerance, value at risk, and strees testing
- know its risk and return goals (must be clear and actionable)
- positive net present value (NPV) after taking risk into account
LO 2.3 Explain how a company can determine whether to hedge specific risk factors, including the role of the board of directors and the process of mapping risks.
- the role of the board of directors
- set and communicate the firm’s risk appetite
- goals must be clear and actionable, criteria to determine the relative success in meeting these goals must be set in advance
- clarify its objectives in terms of whether it is accounting or economic profits that are to be hedged (impossible to hedge both of them at the same time)
- the issue of hedging short-term versus long-term accounting profits needs to be considered
- the board must be definitive in the time horizon when determining its risk management goals for management to achieve
- the board may wish to implement definitive and quantitative risk limits within which management is allowed to transact at its own discretion
- the process of mapping risks
- which risks to accept and which ones to manage
- various risk classes
- detailed analysis of the impacts of such risks on the firm’s financial position (balance sheet) and financial performance (income statement)
- research and identify the top 10 risk exposures
Hedging Operational and Financial Risks
LO 2.4 Apply appropriate methods to hedge operational and financial risks, including pricing, foreign currency, and interest rate risk.
- risk
operational risk: the risk arises from a firm’s activities in production (costs) and sales (revenue)financial position risk: risk arises from a firm’s balance sheetpricing risk: the variability of the price/cost of inputsforeign currency risk: exchange rate fluctuationsinterest rate risk: interest rate fluctuations
- methods
- static hedging strategies
- dynamic hedging strategies
Risk Management Instruments
LO 2.5 Assess the impact of risk management instruments.
- exchange-traded
- over the counter (OTC)
Corporate Governance and Risk Management
Best Practices
LO 3.1 Compare and contrast best practices in corporate governance with those of risk management.
- best practices in corporate governance
- a majority of independent members with basic knowledge of the frim’s business and industry
- watch out for the interests of all stakeholders including shareholders and debtholders
- aware of any agency risks and takes steps to reduce them (e.g. compensation committee)
- maintains its independence from management
- consider the introduction of a chief risk officer
- best practices in risk management
- focus on the firm’s economic performance over accounting performance
- promote a robust risk management process within the firm
- set up an ethics commitee
- compensation is based on risk-adjusted performance
- approve all major transactions
- apply professional skepticism to ask probing and relevant questions to management
- a risk committee in place
Risk Governance
LO 3.2 Assess the role and responsibilities of the board of directiors in risk governance.
The role of the board of directors in governance would include the review and analysis of
- risk management policies
- periodic risk management reports
- appetite and its impact on business strategy
- internal controls
- financial statements and disclosures
- related parties and related party transactions
- any audit reports from internal or external audits
- coporate governance best practices for the industry
- risk management practices of competitors and the industry
LO 3.4 Distinguish the different mechanisms for transmitting risk governance throughout an organization.
- the audit committee of the board
- a risk advisory director
- risk management committee and the compensation committee
Risk Appetite and Business Strategy
LO 3.3 Evaluate the relationship between a firm’s risk appetite and its business strategy, including the role of incentives.
- risk appetite (willingness or tolerance to accept risk)
- define the firm’s risk limits
- logical relationship between the firm’s risk appetite and its business strategy
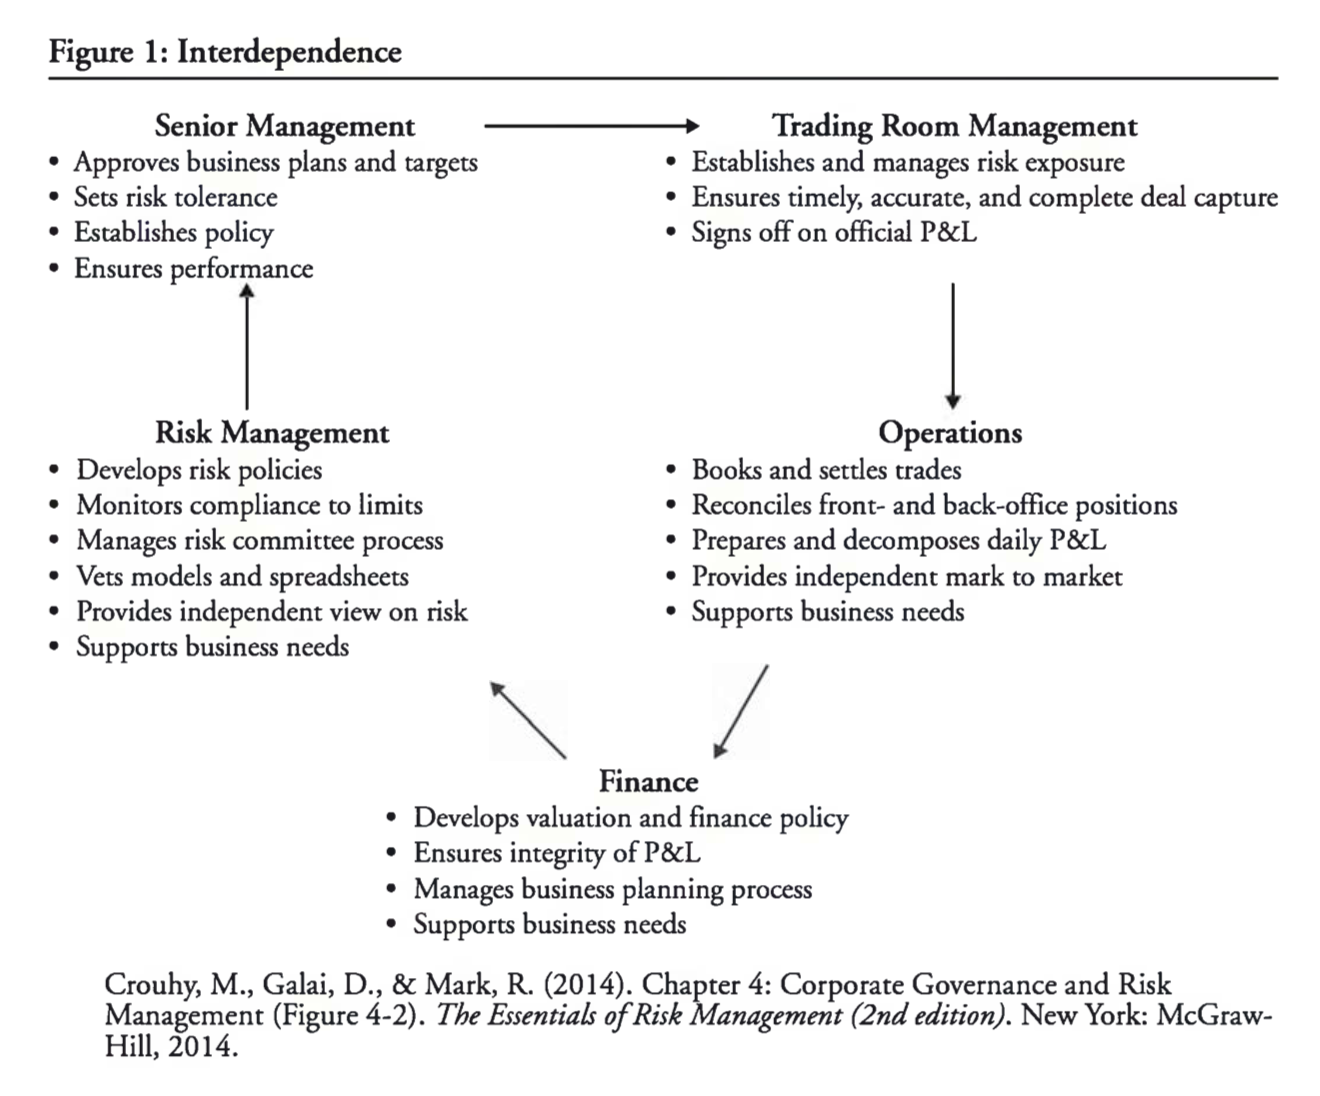
Interdependence of Functional Units
LO 3.5 Illustrate the interdependence of functional units within a firm as it relates to risk management.
using an investment bank as an example
- senior management
- risk management
- trading room management
- operations
- finance
Interdependence of Functional Units
LO 3.6 Assess the role and responsibilities of a firm’s audit committee.
audit committee: responsible for the reasonable accuracy of the firm’s financial statements and its regulatory reporing requirements
What is ERM?
Enterprise Risk Management
LO 4.1 Describe enterprise risk management (ERM) and compare and contrast differing definitions of ERM.
Enterprise risk management (ERM): a comprehensisve and integrated framework for managing a firm’s key risks to meet business objectives, minimize unexpected earnings volatility, and maximize firm value.
ERM Benefits and Costs
LO 4.2 Compare the benefits and costs of ERM and describe the motivations for a firm to adopt an ERM initiative.
- benefits and costs
- benefits: see below
- costs: costly (both capital and labor intensive) and time-consuming
- motivations
- integration of risk organization (increased organizational effectiveness)
- integration of risk transfer ( better risk reporting)
- integrations of business process (improved business performance)
The Chief Risk Officer
LO 4.3 Describe the role and responsibilities of a chief risk officer (CRO) and assess how the CRO should interact with other senior management.
- role and responsibilities
- all risks facing a company
- develop and implement an ERM strategy
- provide overall leadership for ERM, and develop policies and standards including setting the firm’s overall risk appetite, measuring and quantifying risks and setting risk limits, and developing risk systems
- interaction with other senior management
- reports to the CEO or CDO but could also have a dotted line relationship to both the CEO/CFO and to the board
- critical skills
- leadership
- power of persuasion
- ability to protect the firm’s assets
- technical skills to understand all risks
- consulting skills to educate the board and business functions on risk management
ERM Frameworks Components
LO 4.4 Distinguish between components of an ERM program.
- corporate governance
- line management
- portfolio management
- risk transfer
- risk analytics
- data and technology resources
- stakeholder management
Risk Management, Governance, Culture, and Risk Taking in Banks
Optimal Level of Risk
LO 5.1 Assess methods that banks can use to determine their optimal level of risk exposure, and explain how the optimal level of risk can differ across banks.
- methods
- target a certain default probability or credit rating
- sensitivity or scenario analysis
- how the optimal level of risk can differ across banks
- the specific focus of the bank’s activites (e.g., lending, deposits, derivatives)
- the relationship between the value of a bank and its credit rating is concave
Risk-Taking Implications
LO 5.2 Describe implications for a bank if it takes too little or too much risk compared to its optimal level.
- Banks need to take on an optimal amount of risk in order to maximize shareholder value while satisfying the constraints imposed by bank regulators.
LO 5.3 Explain ways in which risk management can add or destroy value for a bank.
- value due to invremental changes in risk taken v.s. the value of a bank
- inflexible/flexible risk management process
- can add value by requiring business units to take the perspective of the entire bank when making decisions regarding risks
Risk Management Challenges and Limitations
LO 5.4 Describe structual challenges and limitations to effective risk management, including the use of VaR in setting limits.
- structual challenges and limitations
- Limitations of Hedging: risk management through hedging alone will not result in risk management becoming a passive activity due to
- risk measurement technology limitations
- hedging limitations
- risk taker incentive limitations
- Role of risk management within a bank
- the risk management function within a bank would be independent of the activities of the business lines
- if the risk management process is viewed as a form of internal policing, then the necessary dialogue between risk managers and business unti managers will not exist
- Value at Risk
- the ability to adjust VaR by trading efficiently to ensure that
- firmwide VaR is not likely to account for all of the bank’s risks, especially operational risk
- need to consider colrrelation estimates between all risks
- insuffficient data available to make such estimates accurately
- different types of risk will lead to differing statistical distributions
- Limitations of Hedging: risk management through hedging alone will not result in risk management becoming a passive activity due to
Bank Risk Profile and Performance
LO 5.5 Assess the poential impact of a bank’s governance, incentive structure, and risk culture on its risk profile and its performance.
- governance
- inventives
- risk culture
Financial Disasters
LO 6.1 Analyze the key factors that led to and derive the lessons learned from the following risk management case studies.
Chase Manhattan and their involvement with Drysdale Securities
Kidder Peabody
Barings
Allied Irish Bank
Union Bank of Switzerland (UBS)
Societe Generale
Long Term Capital Management (LTCM)
Metallgesellschaft
Bankers Trust
JPMorgan, Citigroup and Enron
- Misleading Reporting Cases
- Customer Conduct Cases
- Large Unexpected Market Movements
Deciphering the Liquidity and Credit Crunch 2007–2008
Key Factors Leading to the Housing Bubble
LO 7.1 Describe the key factors the led to the housing bubble.
- cheap credit
- decline in lending standards
Banking Industry Trends and The Liquidity Squeeze
LO 7.2 Explain the banking industry trends leading up to the liquidity sequeeze and assess the triggers for the liquidity crisis.
- originate-to-distribute model
- asset-liability maturity mismatches
Collateralized Debt Obligations
LO 7.3 Explain how banks created collateralized debt obligations.
- bundle a number of debt instruments, such as bonds and loans
- this portfolio is sliced into various tranches
- the different tranches are sold to investors with varying appetites of risk
Credit Default Swaps
LO 7.4 Explain the purposes and uses of credit default swaps
credit default swaps: insurance contracts that pay off in the event of the default of a bond or tranche
Growth of Securitization and Structured Products
LO 7.5 Describe how securitized and structured products were used by investor groups and describe the consequences of their incresed use.
- securitized products: originate-to-distribute model refers to the process through which banks create securities based on an underlying pool of mortages, bonds, or other loans and then sell the securities to investors such that the default risk of borrowers can be transferred to investors
- structured products: banks, via structured investoment vehicles (SIVs), used commercial paper and repurchase agreemens (repos) to roll over short-tierm financing for investing in long-term assets
Conseuences of The Financial Crisis
LO 7.6 Describe how the financial crisis triggered a series of worldwide financial and economic consequences.
- rising motage delinquencies and falling housing prices
- taken on too much leverage
- generated large maturity mismatches between assets and liabilities
- become too interconnected
Funding Liquidity and Market Liquidity
LO 7.7 Distinguish between funding liquidity and market liquidity and explain how the evaporation of liquidity can lead to a financial crisis.
funding liquidity: the ability of an institution to settle its obligations when they are duemarket liquidity: the ease with which an asset can be sold without having to lower the price to attract a buyerloss spiral: the forced sale of an asset by a leveraged investor to maintain margin or leverage ratio requirementsmarginal spiral: the forced sales of an asset as a result of an increase in margins or, equivalent speaking, a decline in the leverage ratio
Network Risk
LO 7.8 Analyze how an increase in counterparty credit risk can generate additional funding needs and possible systemic risk.
network risk: arises as a result of an increase in counterparty credit risk, which forces contracting parties to seek additional protection and liquidity enhancement- clearinghouse: can facilitate multilateral netting arrangements
Gettring Up to Speed on the Financial Crisis: A One-Weekend-Reader’s Guide
Financial Crisis Overview
- key terms related to the Financial Crisis
- Asset-backed commercial paper (ABCP)
- Bank run or “run”
- Shadow bank
- Repurchase agreements (repos)
- Haircut
LO 8.1 Distinguish between trigers and vulnerabilities that led to the financial crisis and their contributions to the crisis.
- tiger: the prospect of losses on subprime mortgages
- vulnerabilities: assest-backedd commerical paper (ABCP) & repurchase agreements (repo)
LO 8.2 Describe the main vulnerabilities of short-term debt especially repo agreements and commerical paper.
- housing prices decline -> homeowners default on their mortgage loans -> reduce the value and prices of ABCP -> bank runs on shadow banks and money market mutual funds (MMFs) -> liquidity crisis
- haircut going from zero to 25% -> liquidity crisis on repo agreements
Lehman Brothers Failure
LO 8.3 Assess the consequences of the Lehman failure on the global financial markets.
- tipping point in the financial crisis (Sep 2008)
- run on MMFs
- panic amplifies the losses in the subprime mortgage market
Previous Financial Crises
LO 8.4 Describe the historical background leading to the recent financial crisis.
- the recent financial crisis followed a similar pattern of increased public and private debt, increased credit supply, and increased housing prices and leading to the crises
banking crisis:- a run on banks that leads to a merger, takeover by the government, or closure of a financial institution
- a merger, takeover, government assistance, or closure of a financial institution that spreads to other financial institutions
Panic Periods
LO 8.5 Distinguish between the two main panic periods of the financial crisis and describe the state of the markets during each.
- August 2007: runs on ABCP
- September 2008 - Ocober 2008: Lehman Brothers filed for bankruptcy (run on a particular MMF called Reserve Primary, contagion effect spreaded to other assets)
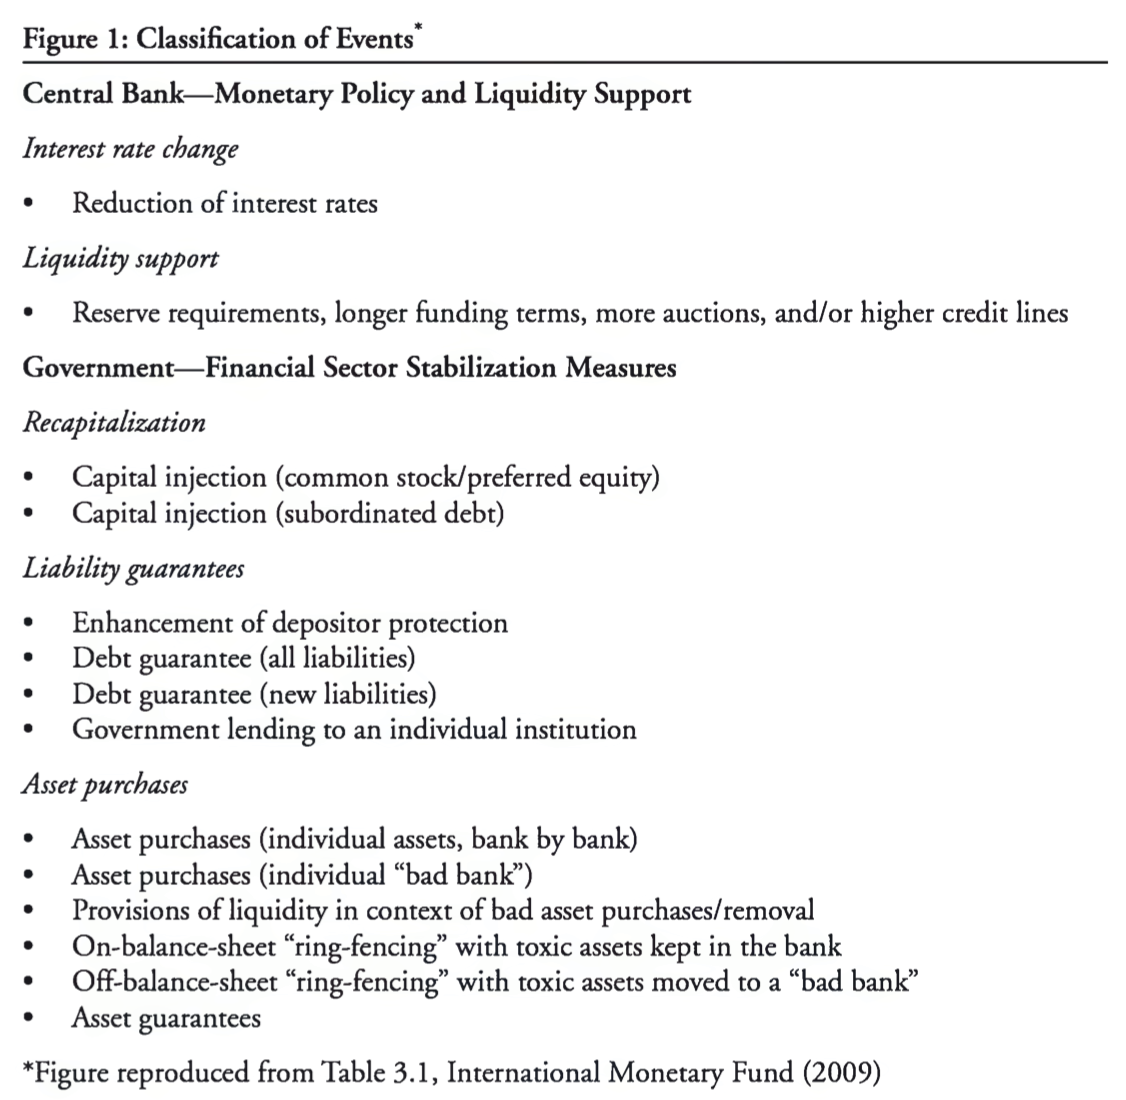
Government Policy Responses
LO 8.6 Assess the governmental policy responses to the financial crisis and review their short-term impact.
types of policies
- interest rate change
- liquidity support
- recapitalization
- liability guarantees
- asset purchases
measurement
- economic stress index (ESI)
- financial stress index (FSI)
- interbank spreads
- an index of credit default swaps (CDSs)
most effective measures
- liquidity support (support the stabilizing the interbank markets before the Lehman failure)
- recapitalization / capital injections (the most effective tool after Lehman failure)
Global Effects on Firms and the Economy
LO 8.7 Describe the global effects of the financial crisis on firms and the real economy.
- as the global recession strengthened, the demand for credit decreased
Risk Management Failures: What Are They and When Do They Happen?
The Role of Risk Management
LO 9.1 Explain how a large financial loss may not necessarily be evidence of a risk management failure.
- losses are the result of risk taking, which is required for value creation
Incorrectly Measuring and Managing Risk
LO 9.2 Analyze and identify instances of risk management failure
- not measuring known risks correctly
- not recognizing some risks
- not communicating risks to top management
- not monitoring risk adequately
- not managing risk adequately
- not using the appropriate risk metrics
LO 9.3 Explain how risk management failures can arise in the following areas: measurement of known risk exposures, identification of risk exposures, communication of risks, and monitoring of risks.
The Role of Risk Metrics
LO 9.4 Evaluate the role of risk metrics and analyze the shortcoming of existing risk metrics.
- risk metrics such as VaR are usually too narrow in scope
- assume independent losses across periods of time
- failt to capture the effect of a firm’s actions on the overall market and behavior patterns such as predatory trading
Delineating Efficient Portfolios
Expected Return and Volatility of a Two-asset Portfolio
- expected return: $E(R{p}) = w{1} E(R{1}) + w{2} E(R_{2})$
- volatility: $\sigma{p}^{2} = w{1}^{2}\sigma{1}^{2} + w{2}^{2}\sigma{2}^{2} + 2w{1}w{2}Cov{1,2}$ where $Cov{1,2} = \rho{1,2} \sigma{1} \sigma{2}$
The Portfolio Possibilities Curve
portfolio possibilities curve: the graph of the expected return v.s. volatility given possible portfolio comibinations
Minimum Variance Portfolio
minimum variance portfolio: the portfolio with the smallest variance among all possible portfolios on a portfolio possibilities cruve
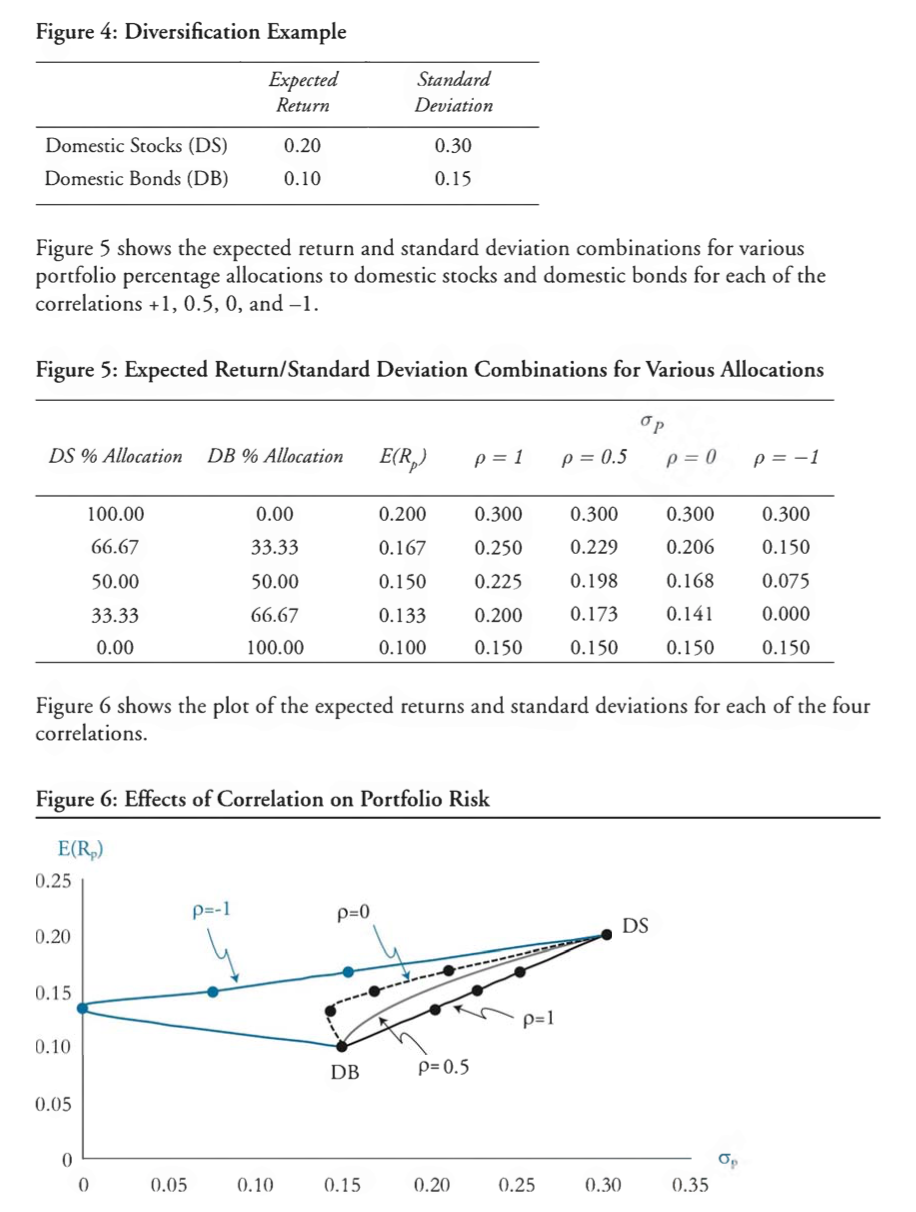
Correlation and Portfolio Diversification
Perfect Positive Correlation: a straight line of possibilities curve
Perfect Negative Correlation: two line segments; $w{1} = \frac{\sigma{2}}{\sigma{1} + \sigma{2}}$
Zero Correlation: non-linear; $w{1} = \frac{\sigma{2}^{2}}{\sigma{1}^{2} + \sigma{2}^{2}}$
Moderate Positive Correlation: non-linear
An Example of Correlation and Portfolio Diversification
The Shape of the Portfolio Possibilities Curve
The Efficient Frontier
Short Sales and the Efficient Frontier
- The efficient frontier expands up and to the right.
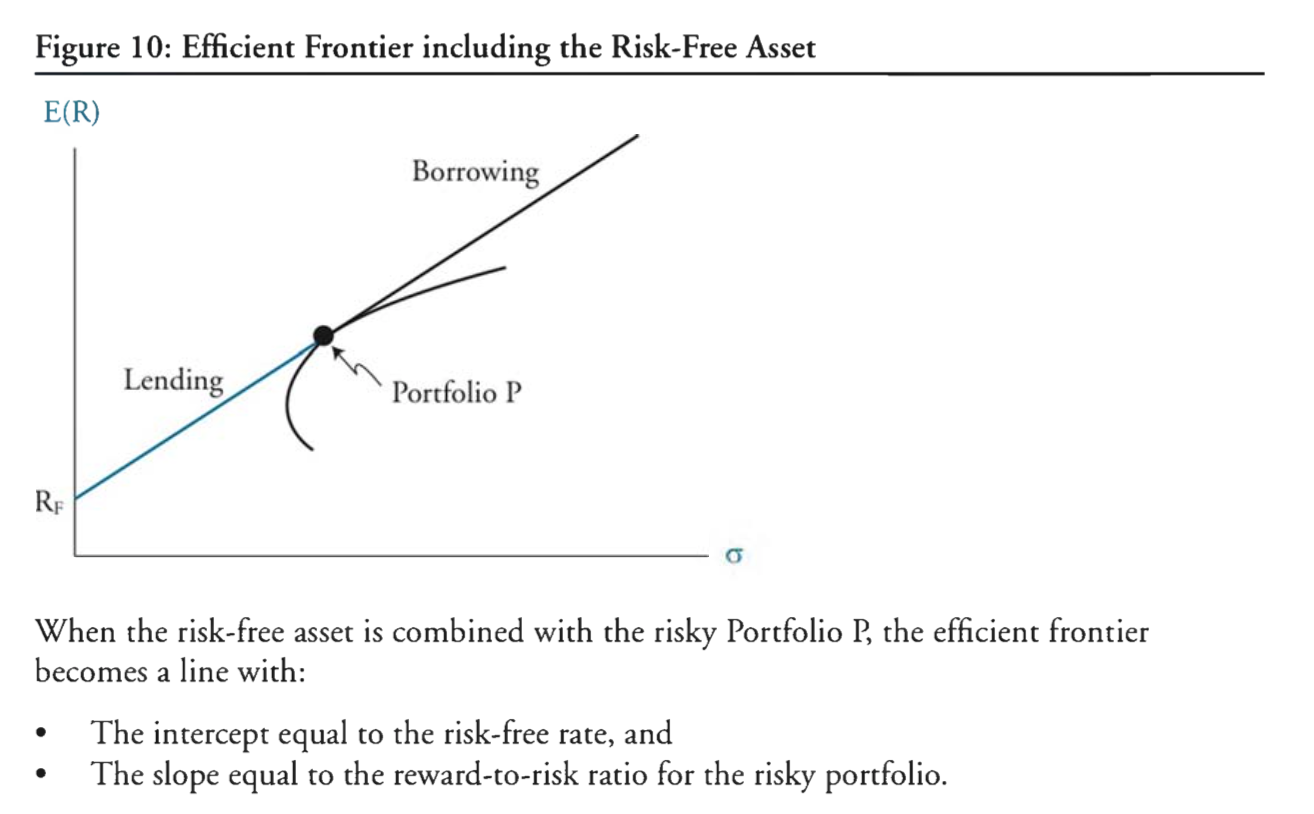
Combining the Risk-Free Rate with the Efficient Frontier
- The shape of the efficient frontier changes from a curve to a line
capital market line: the efficient frontier with risk-free asset $E(R{C}) = R{F} + (\frac{E(R{P} - R{F})}{\sigma{P}}) \sigma{C}$sepration theorem- tangent point of capital market line and the efficient frontier
- risk-neutral/risk-averse/risk-seeking investors
The Standard Capital Asset Pricing Model
The Capital Asset Pricing Model (CAPM)
LO 10.2 Describe the assumptions underlying the CAPM
- no transaction costs
- assets are infinitely divisible
- no taxes
- investors are price takers whose individual buy and sell decisions have no effect on asset prices
- investors’ utility functions are based solely on expected portfolio return and risk
- unlimited short-selling is allowed
- investors are only concerned about returns and risk over a single period, and the single period is the same for all investors
- all investors have the same forecasts of expected returns, variances, and covariances
- all assets are marketable
The Capital Market Line (CML)
LO 10.3 Interpret the capital market line
- $E(R{C}) = R{F} + [\frac{E(R{M}) - R{F}}{\sigma{M}}] \sigma{C}$
Beta
LO 10.5 Interpret beta and calculate the beta of a single asset or portfolio
beta: the sensitivity of an asset’s return to the market return- $\beta{i} = \frac{Cov{i,M}}{\sigma{M}^{2}} = \frac{\sigma{i}}{\sigma{M}} \rho{i,M}$
- portfolio beta is the weighted average of the asset betas in a portfolio
Deriving the CAPM
LO 10.1 Understand the derivation and components of the CAPM
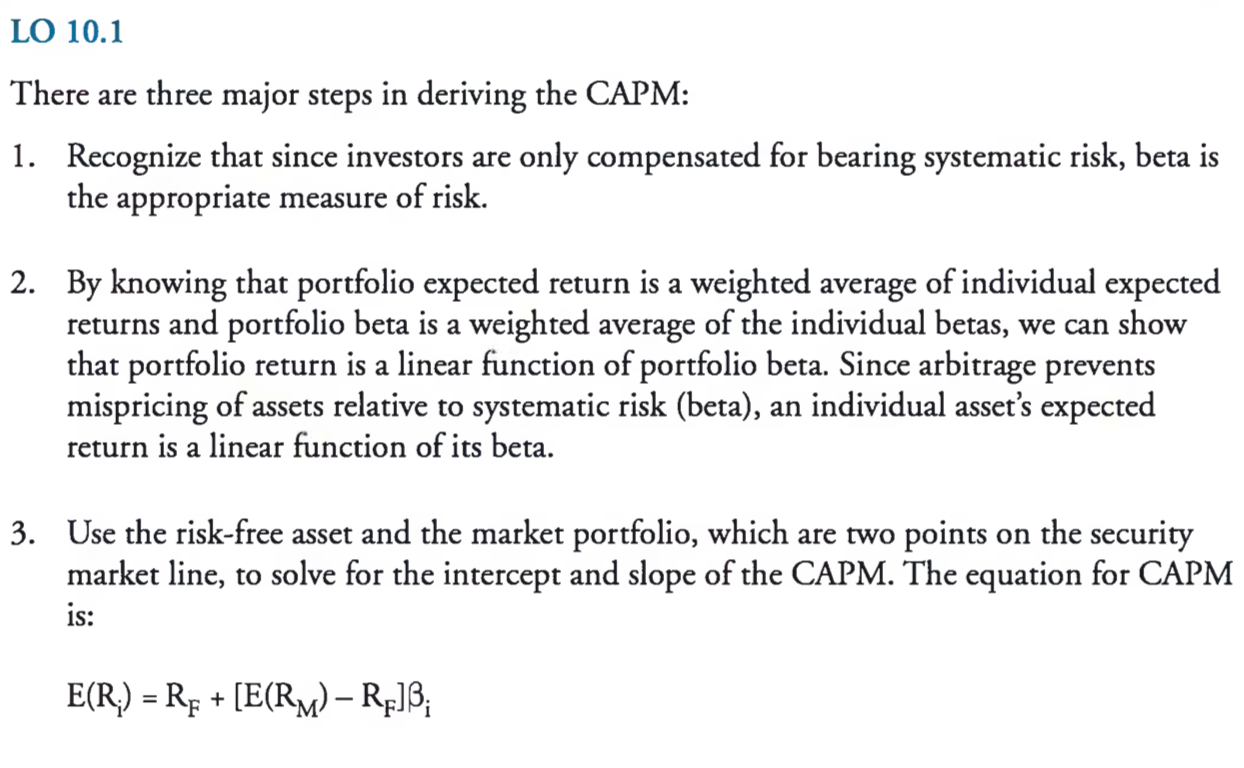
- the variance of an equally-weighted portfolio approaches the average covariance as $n$ gets large
- assets with equivalent betas should earn the same return because arbitrage will prevent assets with the same risk from earning different returns
Calculating Expected Return using the CAPM
LO 10.4 Apply the CAPM in calculating the expected return on an asset
- risk-free rate, market risk premium, and an asset’s systematic risk (beta)
Applying the CAPM to Performance Measurement: Single-Index Performance Measurement Indicators
Measure of Performance
LO 11.1 Calculate, compare, and evaluate the Treynor measure, the Sharpe measure, and Jensen’s alpha.
- calculation
Treynor measure: $\frac{E(R{P}) - R{F}}{\beta_{P}}$Sharpe measure: $\frac{E(R{P}) - R{F}}{\sigma_{P}}$Jensen measure: $\alpha{P} = E(R{P}) - [R{F} + [E(R{M}) - R{F}] \beta{P}]$
- comparison
- Sharpe measure: more widely used than the other two; can be applied to all portfolios since it uses total risks; better method for measuring historical performance
- Treynor measure: compare well-diversified portfolios; a more forward-looking measure
- Jensen’s alpha: compare portfolios that have the same beta
- relationship
- well-diversiffied portfolio: $\beta{P} = \frac{\sigma{P}}{\sigma_{M}}$
- Treynor measure $= \frac{\alpha{P}}{\beta{P}} + [E(R{M}) - R{F}]$
- Sharpe measure $\approx \frac{\alpha{P}}{\sigma{P}} + \frac{E(R{M}) - R{F}}{\sigma{M}} \approx \frac{\mbox{Treynor measure}}{\sigma{M}}$
- extensions to Jensen’s Alpha (raw return in excess of some reference)
LO 11.2 Compute and interpret tracking error, the information ratio, and the Sortino ratio
tracking error: standard deviation of the difference between the portfolio return and the benchmark return- $e{P} = R{P} - R_{B}$
- tracking error $= \sigma{e{P}}$
information ratio: the alpha of the managed portfolio relative to its benchmark divided by the tracking error- information ratio $= \frac{E(R{P}) - E(R{B})}{\sigma{e{P}}} = \frac{\alpha{P}}{\sigma{e_{P}}}$
sortino ratio: a variation of the Sharpe ratio that is more appropriate for a case where returns are not symmetric- sortino ratio $= \frac{E(R{P}) - R{\min}}{\sqrt{MSD{\min}}}$ where $MSD{\min} = \frac{\sum{R{P{t}} < R{min} (R{P{t}} - R_{\min})^{2}}}{N}$
Arbitrage Pricing Theory and Multifactor Models of Risk and Return
The Multifactor Model of Risk and Return
LO 12.1 Describe the inputs, including factor betas, to a multifactor model.
- inputs
- expected return for the stock
- factor betas
- deviation of macroeconomic factors from their expected values
- firm-specific return
- calculation (see k-factor model below)
LO 12.2 Calculate the expected return of an asset using a single-factor and a multifactor model.
- k-factor model: $R = E(R) + \beta{1} F{1} + \beta{2} F{2} + \dotsc + \beta{k} F{k} + e$
- $\beta_{i}$ is the factor beta
- $F_{i}$ is the deviation of macroeconomic factors from their expected values
The Law of One Price and Arbitrage Opportunities
Well-diversified Portfolios
LO 12.3 Describe properties of well-diversified portfolios and explain the impact of diversification on the residual risk of a portfolio.
- the expected return on a well-diversified portfolio (reduction of nonsystematic risk) is determined by systematic risk as measured by beta
a singl-factor security market line (SML): $E(R{P}) = R{F} + \beta{P}[E(R{M} - R_{F})]$ (when no arbitrage opportunities exist, all well-diversified portfolios must lie on the line)- difference between
SMLandCAPM
Hedging Exposures to Multiple Factors
LO 12.4 Explain how to construct a portfolio to hedge exposure to multiple factors.
factor portfolios: well-diversified portfolios with beta equal to one for a single risk factor, and betas equal to zero on the remaining risk factors- hedge multiple risk factors by combining the original portfolio with offsetting positions in the factor portfolios
The Arbitrage Pricing Theory
LO 12.5 Describe and apply the Fame-French three factor model in estimating asset returns.
arbitrage pricing theory: $E(R{i}) = R{F} + \beta{i1}RP{1} + \beta{i2}RP{2} + \dotsc + \beta{ik}RP{k}$ where $RP_{j}$ is the risk premium associated with risk factor $j$- derivation
- create factor portfolios
- derive returns for each factor portfolio
- calculate risk premiums for each factor portfolio (w.r.t. risk-free interest rate)
- assumption
- returns follow a k-factor process
- well-diversified portfolios can be formed
- no arbitrage opportunities exist
- derivation
capital asset pricing modelFama-French three-factor model: market index return, firm size (SMB), and book-to-market (HML) factors
Principles for Effective Data Aggregation and Risk Reporting
Benefits of Risk Data Aggregation
risk data aggregation: defining, gathering and processing risk data according to the bank’s risk reportting requirements to enable the bank to measure its performance against its risk tolerance/appetite.
LO 13.1 Explain the potential benefits of having effective risk data aggregation and reporting.
- an increased ability of managers and the board to anticipate problems
- enhanced ability to identify alternative routes to restore financial health in times of financial stress
- improved resolvability in the event of bank stress or failure
- an enhanced ability to make strategic decisions, increaseing the bank’s efficiency, reducing the chance of loss and ultimately increasing bank profitability
Governance
LO 13.2 Describe key governance principes related to risk data aggregation and risk reporting practives.
- Principle 1: governance
Data Architecture and IT Infrastructure
LO 13.3 Identify the data architecture and IT infrastructure features that can contribute to effective risk data aggregation and risk reporting practices
- Principle 2: data architecture and IT infrastructure
Risk Data Aggregation Capabilities
LO 13.4 Describe characteristics of a strong risk data aggregation capability and demonstrate how these characteristics interact with one another.
- Principle 3: accuracy and integrity
- Principle 4: completeness
- Principle 5: timeliness
- Principle 6: adaptability
Effective Risk Reporting Practices
LO 13.5 Describe characteristics of effective risk reporting practices.
- Principle 7: accuracy
- Principle 8: comprehensiveness
- Principle 9: clarity and usefulness
- Principle 10: frequency
- Principle 11: distribution
GARP Code of Conduct
The Code of Conduct
LO 14.1 Describe the responsibility of each GARP member with respect to professional integrity, ethical conduct, conflicts of interest, confidentiality of information and adherence to generally accepted practices in risk management.
- Principles
- professional integrity and ethical conduct
- conflict of interest
- confidentiality
- Professional Standards
- fundamental responsibilities
- adherence to generally accepted practices in risk management